
The graphing calculator program that comes with every Power Macintosh computer is a very powerful tool for doing algebra. This activity will help you to use this program to explore the graphs of parabolas and absolute value equations.
When you start the graphing calculator, you should see a window similar to this:
You type expressions and equations in the top part of the window. Graphs appear in the bottom part of the window. The buttons on the lower left allow you to zoom in and out. You can see different parts of the graph by dragging the axes with your mouse.
Type the equation y = 2(x - 1)2 - 1 into the graphing calculator. You should see a graph like this:

You can use the zoom buttons in the lower left to zoom in or out. You can click and drag the axes to see other parts of the graph. Click on the graph itself to turn on tracing:
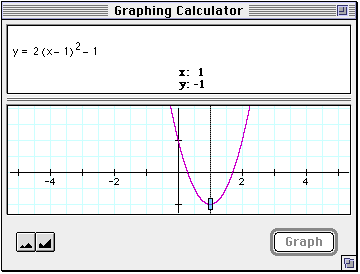
You can click and drag the box to get the coordinates of any point along the graph. The box will "stick" for a moment and make a clicking noise at important points such as the x and y intercepts and the vertex of the parabola. In this example, the vertex is at (1, -1).
Graph the following parabolas. Copy your graphs onto a piece of graph paper. Trace the graph and locate the vertex. Write the coordinates of the vertex on each graph.
|
|
|
|
Type the equation y = n (x - 1)2 - 1 into the graphing calculator. The animation controller will appear at the bottom of your window. Click the n and set the lowest value to -5, the highest value to 5, and the number of steps to 20. Click OK.
Use your mouse to click and drag the slider back and forth. What effect does this have on your graph? What role does the n play in this equation?
Type the equation y = (x - n)2 - 1 into the graphing calculator. Use your mouse to click and drag the slider back and forth. What effect does this have on your graph? What role does the n play in this equation?
Type the equation y = (x - 1)2 - n into the graphing calculator. Use your mouse to click and drag the slider back and forth. What effect does this have on your graph? What role does the n play in this equation?
For the equation y = a (x - h)2 + k, what role do a, h, and k play? Where will the vertex be? What will happen when a is positive? What will happen when a is negative?
Graph the following absolute value equations (you may want to use the small keypad). Copy your graphs onto a piece of graph paper. Trace the graph and locate the vertex. Write the coordinates of the vertex on each graph.
|
|
|
|
Type the equation y = n | x - 1| - 1 into the graphing calculator. The animation controller will appear at the bottom of your window. Click the n and set the lowest value to -5, the highest value to 5, and the number of steps to 20. Click OK.
Use your mouse to click and drag the slider back and forth. What effect does this have on your graph? What role does the n play in this equation?
Type the equation y = | x - n | - 1 into the graphing calculator. Use your mouse to click and drag the slider back and forth. What effect does this have on your graph? What role does the n play in this equation?
Type the equation y = | x - 1 | - n into the graphing calculator. Use your mouse to click and drag the slider back and forth. What effect does this have on your graph? What role does the n play in this equation?
For the equation y = a | x - k | + h, what role do a, h, and k play? Where will the vertex be? What will happen when a is positive? What will happen when a is negative?