The graphing calculator program that comes with every Power Macintosh computer is a very powerful tool for doing algebra. This activity will help you to learn how to use this program to do 3-D graphing.
When you start the graphing calculator, you should see a window similar to this:

You type expressions and equations in the top part of the window. Graphs appear in the bottom part of the window. The buttons on the lower left allow you to zoom in and out. You can rotate the graph by dragging the axes with your mouse.
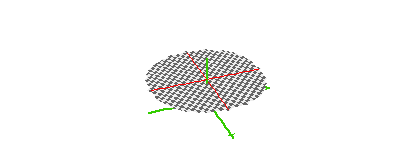
Type the equation z = 1 and click the Graph button (or hit the return key). Your graph should look something like this:

Use the zoom buttons to zoom in and out. Click on the graph and drag it to rotate the graph around the z-axis.
Graph the following equations:
|
|
|
|
The last two equations relate the three variables x, y, and z. This is why the graphs are three dimensional. The axes are the green lines. The z-axis is the one which rises up from the "floor" formed by the x-axis and the y-axis.
You can also use equations which relate the height above the "floor" to the distance from the z-axis. For example, graph these equations:
|
|
|
These graphs are cones where the height above (or below) the "floor" is equal to the distance from the center.
Choose Show Full Keypad from the Equation menu. Graph the following absolute value equations:
|
|
|
|
|
|
In the Graph menu, make sure Circular 3D Base is unchecked. Now graph the following equations:
|
|
|
|
You can also graph equations which relate the height above the "floor" to the angle q measured couter-clockwise from the x-axis. We can use this together with the sin and cos trigonometric functions to create some interesting wave graphs.
Graph the following equations. You will need to use the full keypad to type q:
|
|
|
|
|
|
|
|
These trigonometric functions (which you will study in great depth in Algebra 2) can be used to simulate waves which occur in nature. This would include ocean waves, radio waves, and even waves in the ground during an earthquake. We can use animation to see how some of these things might behave.
Choose to run your animation from 0 to 8 with 40 steps. You can set up your animation by clicking the n in the slide control below the graph. Then graph these equations:
|
|
|
|
The first two graphs will look best if you zoom out a few times, while the third graph will look best if you zoom in a few times. Which of the three equations produced this graph:
